The past year was full of revelations; we learned, as many have long suspected, that criminal risk assessment and online search algorithms reinforce racial biases, and that our phones are always tracking our locations.[i] We learned that, for years, Palantir secretly tested its predictive policing platform in New Orleans, Facebook has been brokering its users’ data, and IBM has been using New York Police Department surveillance footage to develop object- and facial-recognition software.[ii] We discovered that Google and Amazon and Microsoft have been (and, in some cases, still are) developing technologies for policing, military operations, and immigration control — technologies likely rife with bias, applied toward the perpetuation of mass incarceration and surveillance, “precision” warfare, and the separation and detention of immigrants.
Some have recognized a need for intervention — an intermediary step between the transformation of hoovered-up “data” into actionable (perhaps even weaponized) “intelligence.” Tech companies, forced to testify before Congress, pledged greater oversight and more stringent enforcement of conduct codes. As the Justice Department threatens regulation, some of the same platforms engaged in surveillance and profiling and aggressive target-marketing are acknowledging their imposed sociopolitical and epistemological roles, as well as the responsibilities that come along with them. CEO Jack Dorsey admitted that Twitter has become a “public square,” and thus it’s the company’s responsibility to “increase the health of public conversation.”[iii]
In organizing the world’s knowledge and hosting diplomatic dialogue between world leaders, these forums, while global in scope, have perhaps recognized with some reluctance that they have obligations to safeguard democratic processes and privacy, particularly among their domestic users. Many local data creators and stewards, like municipalities and city libraries, have long recognized such obligations, perhaps in part because the individuals and organizations to whom they’re accountable, and the potential consequences for mismanagement, are more immediate and visceral. Plus, local data systems are frequently working with open data and aren’t motivated by the same drives for profit and world domination. Yet we know that, in recent years, companies like Palantir, IBM, and Google have sold their wares to municipal governments seeking greater efficiency and accuracy, and to local officials lured by the promise of access to vast troves of networked data. Those contracts can lead to platform lock-in and the black-boxing of local data, not to mention the erosion of local trust.[iv]
Perhaps we need to reassess and reassert the “local codes” of civic data stewardship, which would ideally emphasize transparent partnerships, responsible intermediaries, and checks and balances calibrated to honor core civic values. We might look to see how different communities have joined forces with public institutions to generate, steward, circulate, and activate civic data and other forms of local knowledge. We might ask how these collaborations help not only to generate protocols for the critical, responsible use of local data, but also to shape the design, maintenance, and administration of the spaces they represent, and the values those spatial practices embody. As Yanni Loukissas proposes in his forthcoming book All Data Are Local, “the diversity and prosperity of the world’s varied and contingent digital practices depends on our acceptance of data’s locality.”[v]
In what follows, we’ll address these issues though four case studies, each revealing a system of civic data that helps local populations better understand, adapt to, steer — and in some cases, even resist — urban and ecological change. These systems exemplify the responsible “scaffolding” of data into actionable information and public knowledge. Knowledge management experts and informaticians often speak of an epistemological hierarchy: data, when contextualized, purportedly becomes information, which itself — when further organized — becomes knowledge, which itself — when fully actualized through lived experience — becomes wisdom. The model is not without its critics, but it does at least helpfully foreground the importance of contextualization or scaffolding, and the means by which those intellectual transformations happens. The four following cases model different methods for building critical epistemological scaffoldings that local populations can perhaps orient themselves within, and use to direct the development of their rapidly transforming local terrains.
We first visit Pittsburgh, once a pollution-plagued industrial powerhouse that’s now a hotbed of robotics, automated vehicles, and health care. Here, the Civic Switchboard project connects libraries and community information networks into “civic data ecosystems.” We then travel to Jakarta, a low-lying megacity increasingly prone to climate disasters, where government and citizen-generated data combine to power Peta Bencana, an open-source, community-led platform featuring data about floods and water infrastructure, and aiding in emergency management. Many of the platform’s data points are generated by bodies at risk, wading through inundated streets. Data, we see here, are visceral. So, for our final two cases, we’ll think about spatial data more capaciously, as embodied forms. After Indonesia, we return to two American cities — St. Louis and Atlanta — where racial dynamics have been inscribed in urban form. We study the Office for Creative Research’s iterative Map Room, which partners with local organizations to provide community spaces for collaborative experimental mapping combining the analog, the digital, and the performative. And finally, we head to the West Coast, to another city that, like Pittsburgh, has been dramatically transformed by the tech industry — including most of the corporations we mentioned earlier. We’ll study the Public Knowledge project, a collaboration between the San Francisco Public Library (SFPL) and the San Francisco Museum of Modern Art, which examines the mediated and aesthetic means by which — and the institutions with which — a rapidly evolving city can come to understand, and potentially redirect, its transformation.
And before we begin, I should note that our survey draws on research by scholars, critics, and activists interested in community mapping, civic data, participatory geographic information systems (GIS), civic technology, and related topics. Their shared knowledge about local data has helped others steward data more knowledgeably. And their recent work builds upon an even deeper history of urban media: cities and their citizens have long recognized and organized themselves through maps, guidebooks, plans, aerial photography, and so forth.[vi] All this is to say: place-based data is a big field, and it has a long history. Our four case studies — chosen in part because they’re in-progress and mostly under-the-radar — exemplify local data’s different genealogical pathways and future trajectories.
Scaffolding for Start-Ups and Civic Data: Pittsburgh

Chesapeake and Potomac Telephone Company. View of row of operators. Records of the Women’s Bureau, 1892 – 1995, General Photographic File, 1893 – 1945 National Archives. Source: https://catalog.archives.gov/id/522875
First stop: Pittsburgh, a city well known for its postindustrial renaissance and, more recently, the influx of a host of tech companies — Uber, Amazon, Google, and Duolingo among them — attracted by the computer science department at Carnegie Mellon, and particularly its robotics research.[vii] While these corporations are developing proprietary tools, spinning off start-ups, and transforming neighborhoods and the local economy, many of the city’s public leaders have affirmed their commitment to publicness. Lots of municipal governments have embraced the promise of open civic data to “increase transparency, enhance government efficiency, improve communities, encourage public participation in government, and foster civic innovation and economic development.”[viii] In comparison to firebrand cities like New York and Chicago, Pittsburgh was “a pretty late mover” on the open data front, local data manager Bob Gradeck told me, but a 2013 mayoral election — combined with commitment from the local foundation community, engaged universities, and a tradition of strong, collaborative public institutions — primed modestly sized Pittsburgh to build a robust regional network of information resources.[ix] “The principles were all there before Google came to town,” a team of local data stewards insisted. After all, the the Carnegie libraries were born here. And the city’s public and university libraries offer complementary sets of expertise in the “plumbing” of information stewardship, and in making those resources publicly relevant and accessible.[x]
Pittsburgh is also fortunate to have the Western Pennsylvania Regional Data Center (WPRDC), a data liaison linking local universities and nonprofits to municipal and county governments. Hosted at the University of Pittsburgh, the center has been instrumental in advancing data integration, access, literacy, and use. The center, recognizing that it’s not enough merely to make local data available, consults with issue-specific user groups to determine which data sets are most relevant and likely to help citizens spur policy changes or enforcement activity, and they partner with public libraries to offer workshops on data research, visualization, storytelling, and mapping.[xi]
Now, with funding from the Institute for Museum and Library Services, the WPRDC and the university and public libraries are teaming up with the Urban Institute’s National Neighborhood Indicators Partnership (NNIP). Since 1996, NNIP has been working to create “data intermediaries” connecting local organizations to neighborhood data in order to develop sustainable community information systems that can inform democratic decision-making.[xii] Such intermediaries, like the WPRDC, “build relationships among [data] publishers, users, and other members of the [local data] ecosystem” and work to “enhance data quality, provide feedback mechanisms to publishers, and build tools that enable broader data use.”[xiii] In Pittsburgh, the libraries, the WPRDC, and NNIP have come together to form Civic Switchboard, an assemblage of scaffolds or “middleware” providers who translate between different institutions, data publics, and data sets.[xiv] Civic Switchboard establishes libraries as key operators on that network, yet also acknowledges that “they shouldn’t be doing everything themselves.”[xv]
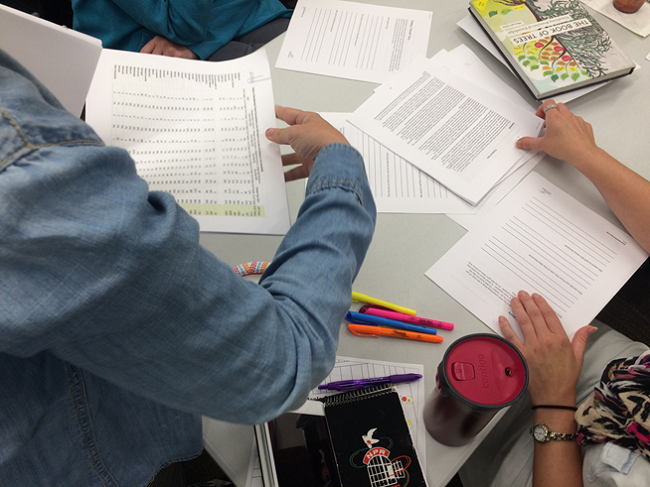
[image of papers and hands at desk] “Data 101 Training Workshop” Photo by Eleanor Tutt, CC-BY 4.0 Source: https://civic-switchboard.github.io/updates/post_2
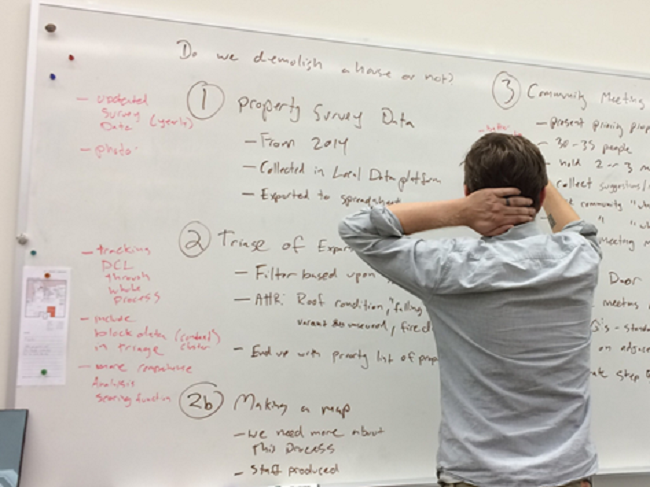
[image of person’s back at whiteboard] “Learning how a community partner uses data” Photo by Liz Monk, CC-BY 4.0. Source: https://civic-switchboard.github.io/updates/post_2
Scaffoldings for Sinking Ground: Jakarta
The local ecosystem in Jakarta, ten thousand miles away, is characterized by another sort of environmental volatility. The city is situated in a low-lying delta among thirteen rivers that flow from the mountains toward the Java Sea. “While Jakarta’s residents have lived with seasonal flooding since the seventeenth century,” Nashin Mahtani reports, “unpredictable weather patterns due to climate change have disrupted traditional patterns of knowledge that previously enabled residents to predict and prepare for the flood’s arrival.”[xxi] “Hundred-year” floods now come roughly every five years. What’s more, as increased development draws water from aquifers, the city is sinking three to ten centimeters every year. Because much of Jakarta is below sea-level, and much of its developed surface is now impermeable, the rivers’ waters must be pumped up and out to sea. As Tomas Holderness and Etienne Turpin explain, Jakarta is subject to a “series of critical infrastructure interdependencies that bear heavily on flood management . . . The collapse of one infrastructure component can trigger cascading failures across urban systems.”[xxii] Unpredictable geological transformations, climate changes, hydrological activity, and infrastructure performance make it difficult to model risk, and there’s “currently very little data in Jakarta detailing the city’s responses to flooding.”[xxiii] Mahtani reports that emergency management agencies had been distributing flood information via static pdf reports, “both making it nearly impossible to communicate time-critical information to thirty-one million urbanites and limiting capacities to gain information from residents.” Without reliable, real-time data, local and national agencies haven’t been able to coordinate efforts or make evidence-based decisions, and residents have had little authoritative direction on what do to in an emergency.
While such infrastructures have been plagued with precarity, the city’s telecommunications systems have proven relatively reliable. Mobile phone penetration is high, equipping residents to serve as nodes within an otherwise impoverished emergency communication network. Enter PetaBencana.id (formerly PetaJakarta.org), a partnership between the SMART Infrastructure Facility of the University of Wollongong, Australia; the Jakarta Emergency Management Agency; and Twitter, that, since 2013, has combined crowd-sourced and official data streams to produce “megacity-scale visualizations” of disasters, thereby improving and “democratizing decision support.”[xxiv] The platform is powered by so-called CogniCity open-source software, which draws on verified, street-level social media updates and instant messages posted real-time during emergency events, and combines them with emergency data from local and government agencies. If the software detects Twitter conversations about “flood,” or “banjir,” within particular geographic areas, the platform’s chat bot will send an invitation — with an embedded, instructional animated GIF — asking users if they would like to contribute a report to the community flood map. If the user says yes, the software then sends a unique link, where the user verifies her location, records flood heights, and adds photos and descriptions.[xxv] The software can plug into any social-media platform with an open application program interface (API); residents can submit reports through the local Qlue smart-city dashboard, through the citizen-journalism platform Pasang Mata, or via the Telegram instant-messaging service. CogniCity gathers, sorts, verifies, and visualizes these myriad data streams — including data sets on pumps and floodgates, waterways, and hydrological infrastructure — transforming “vast volumes of data into actionable information for urban publics and government agency decision-makers.”[xxvi]
Video: PetaBencana Instructional video [1:11]
Video: ISIF ASIA Awards 2017 – PetaBencana.ID: [1:35 to 3:45]
Video:How software works: Peta Jakarta, “CogniCity: Software as Infrastructure for Climate Adaptation”. [23:33]
Developed through years of ethnographic research with partner agencies and residents, the platform, Mahtani says, aims to “bridge critical information gaps between formalized structures of data collection and less formalized situational epistemologies,” transforming social networks into an integral component of the city’s infrastructural assemblage.[xxvii] It has been adopted by Indonesia’s National Emergency Management Agency and drawn other global collaborators: the Urban Risk Lab at the Massachusetts Institute of Technology (MIT), the Pacific Disaster Center at the University of Hawaii, the Humanitarian Open Street Map Team, the Nature Conservancy, and Amazon Web Services, among others.[xxviii] Again, strong institutional commitment could help to ensure sustainability, which is often iffy with open-source projects. The platform was lauded in 2015 by the International Federation of the Red Cross, and in 2016, by the US Federal Communication Commission, and in 2018 it won an honorary mention at Prix Ars Electronica, a high-profile media arts competition. PetaBencana, now run by the nonprofit foundation Yayasan Peta Bencana, is being modified and expanded to address other risks and other geographic regions. And it, like Civic Switchboard, faces the challenges of scaling up: developing a generalizable, portable platform while remaining responsive to local dynamics. International validation and funding permit growth, but also present their own challenges, including those tied to the legacies of colonialism.
Turpin, codirector of the project, explained to me that the nonprofit foundation functions as a sort of intermediary, liaising between local groups — NGOs, municipal and state governments, local labs and universities, etc. — to customize the platform’s design and functionality in each deployment. At the same time, they also ensure that all these new developments “are fed back, [so] the whole system is improved as changes are made in any city. . . . We are now trying to develop an institutionally agnostic network for code maintenance, so a national emergency management agency in Vietnam, an NGO in Mexico, and a public utility in the [United States] can all support each other in using and maintaining the code, even though they have diverse structures and organizational models.”[xxix] As of September 2018, the software served around seventy million people, and Turpin said they expect to reach five hundred million within the next four years. The key to sustainable, responsible growth, he said, is not technological novelty or more data, but locally responsive intermediation and maintenance — maintenance of a platform that, in each of its installations, serves to remind us of humanity’s failure to maintain the physical world we inhabit.
Scaffolding for Sociocultural Shifts: St. Louis and Atlanta
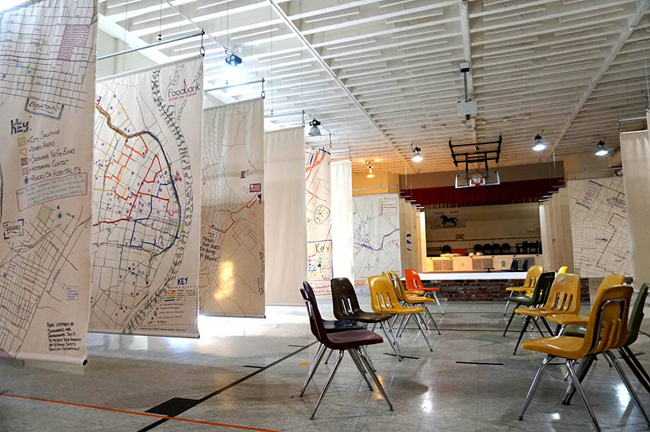
10 foot by 10 foot maps made by students and community groups hang in the gymnasium Stevens Middle School, a shuttered public school in St. Louis’s Vandeventer neighborhood, which was re-activated for The Map Room. Photo credit Jer Thorp.
Such failures manifest themselves in myriad ways. St. Louis, Missouri, has suffered decades of population decline, poverty, and racial segregation.[xxx] Despite local victories in civil rights and efforts at redress, Colin Gordon writes, “inner-city poverty” has historically been “misdiagnosed as a sort of community pathology, as something African Americans had done to themselves.”[xxxi] Yet many local activists and community groups, particularly in the wake of the 2014 shooting of Michael Brown in nearby Ferguson, have developed new opportunities for public engagement and proposed action items for reform.[xxxii]
One such forum for deliberation focused on the discursive potential of civic data. Four years in the making, the St. Louis Map Room, a partnership between the city’s Center for Creative Arts and the New York–based Office for Creative Research (OCR), appeared in a shuttered public school for five weeks in Spring 2017. As I described elsewhere, the Map Room brought people together to think about the geography of their city, and to learn more about one another’s urban patterns, city memories, spatial affinities, territorial aversions, and senses of place.[xxxiii] The organizers stocked the room with historical maps and civic data on everything from land use and tree counts to racial diversity and population change to property values and pollution measures. Also present were map-making robots that plotted fixed cartographic objects like roads and landmarks, leaving the more interpretive, aesthetic, and connotative map activity to the human cartographers.
Video: The St. Louis Map Room: [1:53]
Visiting community groups drew on these cartographic resources, using an iPad interface to project maps and datasets onto ten-by-ten-foot sheets on the floor. They then incorporated their own place-based intelligences with analog art materials. Museum curators, students, activists, health care workers, and other visitor groups mapped multiple St. Louises: homeless St. Louis, St. Louis schools, St. Louis transit, St. Louis’s community gardens, life expectancies in different St. Louis neighborhoods, St. Louis tax abatements, and so forth.[xxxiv] Subsequent visitors could then take those maps and project georectified historic maps or city data on top, exploring new correlations. Yet nearly all participants discovered that historical red-lining maps, which deeply carved racialized patterns of development and resource allocation into the city’s fabric, had an enduring legacy, conditioning so many other, lasting spatial patterns.[xxxv]

Map Room facilitator Emily Catedral leads a group of ninth grade students from Brittany Woods Middle School in exploration of historical and modern civic data sets in the context of their hand-drawn map. Photo credit: Alison McCartney.
As Jer Thorp, leader of the since-disbanded OCR, explained, the maps were intentionally big, to allow for various physical modes of interaction: “Groups of people can gather around a map to look at it from different vantage points. People can walk across the map, experiencing distance in a meaningful way.”[xxxvi] Shifts in scale and perspective abet a new spatial, and social, awareness. There’s a material politics at play here, too. Those large sheets structure collaboration and conversation, and they represent civic intelligence — a mix of official data and “indigenous” knowledge — writ large. They “move civic data from being a resource for urban planners and academics to being an exploratory medium for everyday citizens,” Thorp said.[xxxvii] Those maps have become part of the official archive of St. Louis, and the Map Room’s hardware, plans, and curricula have been open-sourced on a “community page” so that other cities and towns can repeat the experiment. As of September 2018, Thorp said there were active Map Room “branches” in Atlanta, Boston, Philadelphia, and Williamstown, Massachusetts, with new projects on the horizon for New Orleans, the Lower East Side of Manhattan, a Syrian refugee camp in Turkey, small towns on the Yucatan Peninsula, and Maori communities in New Zealand.[xxxviii] Thorp welcomes local variation. He told me he now serves primarily as an intermediator, “stitch[ing] these projects together by connecting members of the projects to one another.”[xxxix]
Like St. Louis, Atlanta has been shaped profoundly by racial segregation and economic inequality, both of which have long undergirded auto-centric development and sprawl.[xl] Yet the new BeltLine, a twenty-two-mile loop of multiuse trails connecting forty-five neighborhoods, promises to spark rejuvenation and integration, to attract new businesses and housing and public transit. Despite the international hype for the project, historically marginalized communities fear gentrification and displacement.[xli] As Mark Pendergrast writes at the start of his City on the Verge, Atlanta “is on the brink of either a tremendous rebirth or inexorable decline,” and the outcome hinges to a large degree on the BeltLine plan’s responsible implementation.
Video: The Atlanta Map Room: [3:45]
Georgia Tech’s Yanni Loukissas has partnered with local scholars, students, and community groups, and sought input from Thorp, to bring the Map Room to Atlanta. By making maps, he proposes, Atlantans can “document and reflect upon the connections and disjunctions between civic data and lived experiences along the BeltLine,” and they can ask bigger questions about Atlanta’s history and identity — about its “rapid development as a commercial hub” and its legacy as a center for civil rights and Black culture.[xlii] As in St. Louis, participants will engage in these discussions over maps combining historical documents, civic data, and personal experiences. Here, though, those maps will be reformatted for a wide view — four-by-sixteen feet — to capture the geometry and dynamics of the BeltLine and other urban edges and corridors. Linear maps, Loukissas told me, also echo other familiar spatial representational techniques, such as sections and transects.[xliii] “We deliberately set out to do something related but different from the St. Louis version,” he said. “In fact, we wrote our own code and built every element of our own system. This was partially due to the difficulty of reusing and adapting the existing code — a pervasive problem that many overlook in their desire to believe that code is universal.”[xliv] Such a caveat likely pertains to Civic Switchboard and Peta Bencana, too.
Given Loukissas’s own research interests in “local data,” including the particular settings in which data sets are made and used and translated, Atlanta’s map-makers will likely engage in discussions about methods and epistemologies. Loukissas proposes that “talking about data in terms of their settings” — including, presumably, the setting of the Map Room itself — “suggests that data are part of larger social and technical systems of people, instruments, and audiences.”[xlv] Thus, as his collaborators make maps that generate discussion about Atlanta’s local dynamics, they’ll also have opportunities to reflect on the geographies and biographies of their sources of local knowledge, too.
Scaffolding for Technological Transformation: The Bay Area
We now route back to where we began, amid the corporate campuses of Facebook, Twitter, and Google in the Bay Area. While these platforms operate on a global scale, employing workers and drawing users from around the world, they’ve also dramatically reshaped their hometown and region. Once an artist and activist enclave — home to the Beats and Black Panthers and LGBTQ movement — San Francisco is now, as Richard Walker describes it, “one of the prime generators of new wealth on the planet, and home to many of the largest and richest corporations astride the globe.” At the same time, he says, it also “reveals the perils of capitalist prosperity”: it “suffers from a host of persistent problems, such as wildly gyrating growth, shamefully unaffordable housing, ghastly homelessness, a plethora of low-wage work, and severe air pollution.”[xlvi]Privatization and gentrification, driven largely by tech companies and their well-paid employees, are squeezing public services. Still, other public services step up to fill in the gaps. The SFPL, one of few free, welcoming places downtown, provides social services and outreach for the city’s large homeless population.[xlvii] Its team of eight health and safety associates, themselves mostly formerly homeless individuals, has become a national model.
And while the local tech platforms might have expanded into global “public squares,” they’re disrupting the local ones. In 2017, the SFPL paired up with SFMOMA to begin examining how these technological and urban changes have transformed public culture — and public institutions’ places within it. The two-year Public Knowledge project seeks to explore the flip-side of the boom: “[the] fraying sense of community as everyday life becomes more precarious; the disappearance of an inclusive and diverse cultural ecology as nonprofit organizations and cultural spaces are priced out of neighborhoods; and the loss of cultural memory for those without the means to represent themselves.”[xlviii]
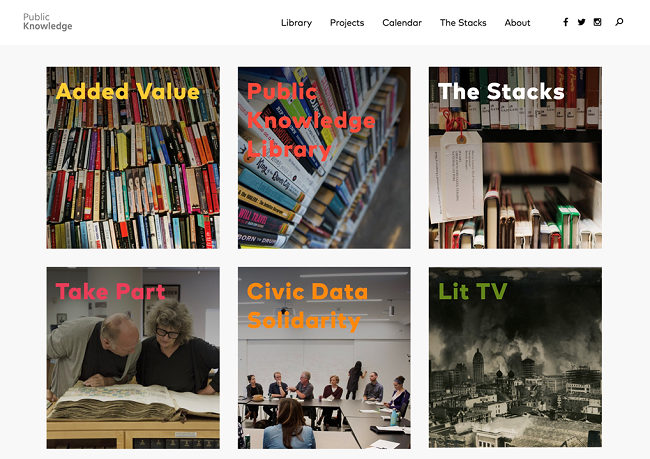
Screenshot of Projects page from Public Knowledge website. Source: https://publicknowledge.sfmoma.org/projects/
Culture and memory are the SFPL’s and SFMOMA’s business. Yet their ability to foster diversity and inclusion — to empower communities to shape their own civic knowledge — is delimited by the technology firms in their own backyards. These companies provide many of the tools and resources their patrons depend on to access information, but they also shape the physical, political-economic, and protocological terrains in which patrons encounter those materials. The corporate influence extends to the epistemological realm — the settings where data become information and information becomes knowledge. As the Public Knowledge organizers write, the tech industry “has disrupted what knowledge is, how it is produced, and how it is circulated. As information and resources are increasingly privatized and public trust is eroded, how can the forms and institutions of public knowledge be maintained?”[xlix] What role should the library and museum — and their community partners — play in knowledge’s production, circulation, and maintenance? And how can these institutions, with their different service models, learn from one another in this epistemological pursuit?
Public Knowledge has been addressing these questions through a series of research collaborations, public programs, and art and publishing projects, which, collectively, adopt a capacious understanding of civic data and public knowledge. The project’s own “public square” is the Public Knowledge Library, a temporary branch of the SFPL housed within SFMOMA. It holds a collection of materials focusing on two self-reflexive themes: public libraries and San Francisco, past, present, and future. The library also serves as a venue for public dialogues — including a January 2018 panel discussion on mapping in which I took part. Some of those dialogues then continue on the Stacks, an online publication fostering connections between curators, scholars, writers, artists, and community leaders and members.
Another such conversation took place in September 2017. The three-day “Does Art Have Users?” symposium explored the uses of art as a form of public knowledge, the value of socially engaged art practices, and the place of art in a rapidly gentrifying city. The forum also allowed for an “intermediation” between the two Public Knowledge partner institutions — a translation between museological and library modes of operation. The organizers explained that they wanted to move beyond the archival theories that have been so popular in the art world, and to ask instead how a “library model of usership might translate to the practicing and teaching of contemporary art. How might art and other cultural institutions be made more ‘useful’ by thinking of themselves as visual libraries, and what is the role of information retrieval in artistic practices?” This gathering thus served as a temporary Switchboard, like those they’re organizing in Pittsburgh, where different knowledge institutions develop “scaffoldings” for sharing knowledge.
A year later, Stephanie Syjuco’s Added Value project further unpacked the library’s intellectual scaffoldings. Organized in collaboration with the local Prelinger Library and the Related Tactics collective, and hosted in the museum’s Helen and Charles Schwab Hall, this three-day September 2018 book sale benefitted the Friends of the SFPL. Yet this wasn’t an ordinary book sale. The unorthodox display of bibliographic wares and a parallel program of events served to raise questions about books-as-knowledge-forms and the politics of organization: “How do the ways in which we categorize books and information reflect invisible power structures and hidden hierarchies?” the organizers asked. “What would an intervention into this system look like, and how can artistic processes re-shape, re-organize, and re-evaluate it?”[l]
Josh Kun’s Hit Parade likewise experimented with organization, but in another key. He recatalogued particular historical local items within the SFPL’s music library. While in the 1930s the term hit parade referred to popular tunes, here, Kun uses it to identify music that, while perhaps once popular, has fallen out of circulation and audition, but which still evokes local neighborhood histories and hints at contemporary “hits,” or blows, like gentrification and eviction.[li] He asks: how might music function as historical “civic data”? What can we know about a city’s travails and painful transformations through its homegrown sounds?
Other Public Knowledge artists further expanded the notion of what constitutes a “knowledge form,” or from what media we might derive meaningful civic data. In their Take Part project, Dutch duo Bik Van der Pol deploy a nine hundred-square-foot model of San Francisco built in the late 1930s by the Works Progress Administration for use as a city planning and teaching tool and a tourist attraction. The model, which most likely hasn’t been on display since 1941 and has been stored piecemeal in distributed facilities, will first be cleaned and assessed by museum staff. Throughout this maintenance process, the artists have hosted public conversations with experts about the “model’s production, archiving, and reassembly as a practice of ‘collective aesthetics.’ ”[lii] They, like Loukissas, reflect on the model as a form of “local data,” both produced and assessed in particular epistemological settings. The title Take Part signals this pedagogical mission; it references a community-planning workshop process conceived in the 1970s by Lawrence and Anna Halprin, a landscape architect and dancer duo.[liii] The process promotes reflexivity about collective creativity and problem-solving, and it, like the Map Rooms we visited earlier, sets up the material and social conditions for collaborative knowledge production.
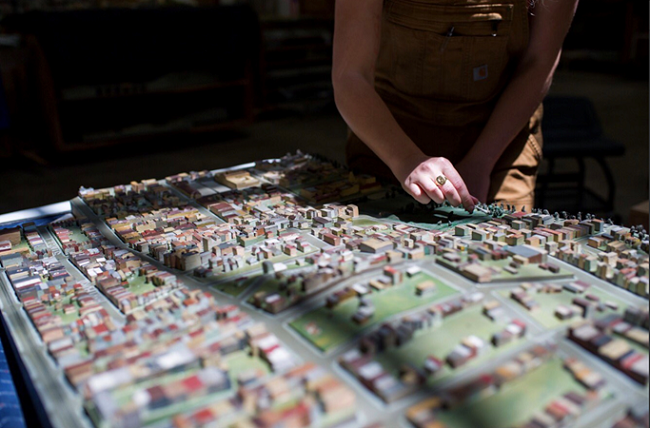
Stella Lochman, Public Dialogue Senior Program Associate, cleaning a piece of the model. Photo credit: Beth LaBerge.
In 2019, Bik Van Der Pol will work with the Public Knowledge team to deliver parts of the model to their corresponding neighborhoods’ branch libraries, where they’ll gather local experts and community members for talks, walks, stories, and other creative activities remembering San Francisco’s pasts, interrogating its presents, and imagining its futures.[liv] There, too, discussions will likely address how art and other epistemological objects, like the model, can create a space for critique and speculation. And finally, in late 2019, the model will be assembled as a whole (in whatever venue is large enough to house it!), alongside all of its documentation and “metadata,” and amid public conversation.
While Take Part emphasizes the preservation of a neglected knowledge object, Minerva Cuevas’s Public Knowledge project examines knowledge’s creation and destruction. Her video Lit TV examines fire as both one of the earliest forms of public knowledge — a foundation of civilization, a symbol of revolution and enlightenment — and, at the same time, a cause of cultural and environmental destruction. According to curator Deena Chalabi, Cuevas “explores the ways that fire has destroyed and remade cultural life in San Francisco,” reminding us of the value — and, I would add, the vulnerability — “of libraries as repositories of knowledge and spaces for reflection and community.”[lv] Fire is also a multifaceted symbol for the world of Silicon Valley, with its fixation on virality and disruption, and its capacity to fuel conflagratory economic activity.[lvi] Cuevas’s video, made in collaboration with local youth groups, will be available at SFPL branches and online.
Data, like fire — and the floods we encountered earlier, in Jakarta — has a tendency to spread. Likewise, data, if unmanaged, has the power to wreak havoc. Artist Burak Arikan creates data models, or network diagrams, of power structures; in the past, he has used his Graph Commons software to map the political dynamics of Internet governance, penal systems, and corporatized higher education, among other systems. He described his method in a 2014 interview: “Counter-mapping is a way to use collective intelligence in civil interrogation of power structures.”[lvii] As in the Map Room, “presenting . . . research in the form of maps and having a social discussion around it, results in an epiphanic experience of both form and discourse.” In other words, maps give us things to think with, and they’re catalysts for discussion.
His Civic Data Solidarity project for Public Knowledge aims to serve as an intermediary between different civil society organizations that are generating disparate sets of civic data about powerful institutions and individuals whose actions impact citizens.[lviii] How might the normalization of these data sets and the creation of consistent metadata allow us to “make civic data interoperable across civil society projects and tools,” so we can track correlations between different social, political, and economic forces?[lix] Arikan has chosen two case studies — diversity in Silicon Valley and environmental racism in various Bay Area neighborhoods — and has been organizing workshops with experts from various civil society organizations and other stakeholders to facilitate this intermediation — to serve, we might say, as a “switchboard.” For his first case, he’s paired up with data reporter Sinduja Rangaran from the Center for Investigative Reporting (CIR), with whom he plans to host workshops involving local diversity and inclusion human resources officers, investors and journalists interested in diversity and inclusion, among others.[lx] For the second case, he’s joined forces with artist Jin Zhu, a member of the Anti-Eviction Mapping Project, as well as University of California, Santa Cruz, sociologist Lindsey Dillon to conduct interviews and collect data on Treasure Island, a former military base and dock for ships equipped with nuclear bombs, which is now the site of a major development project.[lxi]
The ethical guidelines underlying Civic Data Solidarity resemble those informing the Civic Switchboard, Peta Bencana, the Map Room, and Loukissas’s work. Arikan plans to encourage data creators, publishers, users, vendors, etc., to ask such questions as: Who are the subjects and makers of this data? How is it generated, and what are the politics underlying the conditions — or “settings,” Loukissas might say — of its generation? How can we link data sets possessing different degrees of fidelity or granularity? What makes a data set trustworthy? How can we incentivize stewardship to ensure data’s maintenance and preservation? How can we make data discoverable and accessible? And how can we license data to aid in its attribution?
These are all generalizable concerns, but they often demand local responses, as we saw in Pittsburgh and Jakarta and St. Louis and Atlanta. Even in San Francisco, where so much of the data flowing through its servers is meant for global consumption, data and tech policy have profound local resonance. Several of the questions Arikan poses are pertinent to contemporary debates about the responsibilities of Silicon Valley platforms — those same questions we examined in the introduction. How can we protect vulnerable data subjects? How can civic data support informed public discourse and amplify the voices of those affected by social change? How can merged data sets be used to effect political transformation?[lxii]
I would hope that the Civic Data Solidarity collaborators will also ask more fundamental methodological and epistemological questions — about the potential limitations of network mapping, and about the conclusions one reasonably can draw from correlated data sets or homologous network forms (Megan Martenyi reported that, at a September 2017 workshop, some participants “voiced concerns about [the] unintended consequences of consolidating and linking data sets, unsure if intention alone could turn surveillance technologies to subversive ends”).[lxiii] Perhaps, to some degree, the collection of data and mapping of networks is an excuse for getting stakeholders together in a room and focusing their attention and dialogue on complex issues. It’s just as much about the talk as it is about the maps themselves. Martenyi acknowledges that “many of the participating groups would not ordinarily work together,” and they lacked a common understanding of what constituted “data” and how it could be useful. Yet their gathering at SFMOMA, she says, “played an important role in setting a tone where critical incompatibilities could be examined and engaged, and yet remain unresolved.”[lxiv]
Another discussion took place in October 2018, amid the midterm elections, when Public Knowledge joined with the University of Californnia, Berkeley’s Center for New Media, School of Journalism, and School of Law to host a symposium. There, Arikan, alongside other technologists, scholars, and critics, examined how data can be used, for better or worse, to “hack politics.”[lxv] The hacking of politics around the 2016 US election is what put tech policy and data ethics on the radar screens of many global and local leaders who wouldn’t otherwise care about such administrivia. And what many are realizing is that the solution for these global challenges doesn’t reside solely in national laws or global agreements or corporate self-policing. Remediation also depends on local codes — partnerships between communities and municipalities and public institutions; policies that emphasize responsible intermediation and critical scaffoldings; practices that engender the ethical, critical use of civic data. All of which have the potential to generate and steward public knowledge and public squares, online and off-, that serve their communities.
ACKNOWLEDGMENTS: Thanks to Aaron Brenner, Deena Chalabi, Bob Gradeck, Toby Greenwalt, Yanni Loukissas, Nora Mattern (no relation), Kathy Pettit, Jer Thorp. I’m also grateful to Parvaneh Abbaspour, Mark Dahl, and Elaine Hirsch at Lewis and Clark College, and James English and Stewart Varner at the University of Pennsylvania, all of whom invited me to share this work at their institutions.
AUTHOR’S NOTE: Since this piece was published, public allegations of inappropriate behavior have been made against one of its sources, Etienne Turpin. I’ve chosen to retain the article as it was originally published to honor the work of the project’s many local contributors and (unacknowledged) collaborators from around the world. – Shannon Mattern, July 17, 2019
_____________________________
[i] Julia Angwin, Jeff Larson, Surya Mattu, and Lauren Kirchner, “Machine Bias,” Pro Publica (May 23, 2016); Safiya Noble, Algorithms of Oppression: How Search Algorithms Reinforce Racism (New York: NYU Press, 2018).
[ii] George Joseph and Kenneth Lipp, “IBM Used NYPD Surveillance Footage to Develop Technology that Lets Police Search by Skin Color,” The Intercept (September 6, 2018); Oscar Schwartz, “Google Knows Where You Are at All Times and There Is Almost Nothing You Can Do about It,” The Outline (August 13, 2018); Ali Winston, “Palantir Has Secretly Been Using New Orleans to Test Its Predictive Policing Technology,” The Intercept (February 27, 2018).
[iii] Edgar Alvarez, “Twitter Wants to ‘Increase the Health of Public Conversation,’ ” Engadget (September 5, 2018).
[iv] Mark Harris, “How Peter Thiel’s Secretive Data Company Pushed into Policing,” Wired (August 8, 2017).
[v] Yanni Loukissas, All Data Are Local: Thinking Critically in a Data-Driven Society (Cambridge, MA: MIT Press, forthcoming 2019): manuscript p. 19.
[vi] Consider the work of Jeremy Crampton, Sarah Elwood, Dietmar Offenhuber, and Matthew W. Wilson. See also Jo Guldi, “A History of the Participatory Map,” Public Culture 29:1 (2016): 79–112; and Arnaud Sahuguet, John Krauss, Luis Palacios, and David Sangokoya, “Open Civic Data: Of People, By the People, For the People,” IEEE (2014): 15–26.
[vii] Scott Andes, Mitch Horowitz, Ryan Helwig, and Bruce Katz, “Capturing the Next Economy: Pittsburgh’s Rise as a Global Innovation City,” Brookings Institution (2017); Richard Florida, “How Uber’s Driverless Cars Could Make Pittsburgh America’s Next Great Tech Hub,” The Atlantic (June 3, 2015); Alison Griswold, “Pittsburgh Has Finally Realized It’s in a Toxic Relationship with Uber,” Quartz (February 7, 2017); Steven Kurutz, “Pittsburgh Gets a Tech Makeover,” New York Times (July 22, 2017); Adam Lashinsky, Wild Ride: Inside Uber’s Quest for World Domination (New York: Penguin, 2017).
[viii] “Introducing Civic Switchboard: Connecting Libraries and Community Information Networks,” Civic Switchboard (December 11, 2017).
[ix] Civic Switchboard Team (Aaron Brenner, Bob Gradeck, Tony Greenwalt, Nora Mattern, Liz Monk, Kathy Pettit), personal communication, September 18, 2018.
[x] University of Pittsburgh librarian Aaron Brenner said that the university library had “plumbing expertise” with “stewarding data and making it accessible,” and it wondered, “how do we share that expertise within our community and in our region?” Toby Greenwalt, from the public Carnegie Library, noted that his institution was focused on providing community-centric contexts for information resources that “speak to the actual needs of the public.” And Liz Monk, from the Western Pennsylvania Regional Data Center, called out the university’s skill in “aggregating data into meaningful geographies for neighborhoods’ use” in making decisions. Personal communication, September 18, 2018.
[xi] Robert Burack, “Pittsburgh’s Regional and Inclusive Approach to Open Data,” Data-Smart City Solutions (October 24, 2016).
[xii] Leah Hendey, Jake Cowan, G. Thomas Kingsley, and Kathryn L. S. Pettit, “NNIP’s Guide to Starting a Local Data Intermediary” (National Neighborhood Indicators Partnership, May 2016); National Neighborhood Indicators Partnership, “NNIP Concept” (n.d.). For more on civic intermediaries, see Kelly LeRoux, “Nonprofits as Civic Intermediaries: The Role of Community-Based Organizations in Promoting Political Participation,” Urban Affairs Review 42:3 (2007): 410–22; Eric S. Zeemering, Collaborative Strategies for Sustainable Cities: Economy, Environment, and Community in Baltimore (New York: Routledge, 2014): 25–6.
[xiii] I’ve changed the verbs in these quoted passages from gerunds to present tense. University of Pittsburgh, “Developing Public and Academic Libraries as Key Participants in Civic Open Data Ecosystems,” IMLS Final Project Proposal (2017): i. Data intermediaries also, ideally, steward metadata and related documentation, “including data-sharing agreements and codebooks for individual fields. They must also ensure safeguards are in place to prevent unauthorized access and use.” Amanda Ziadeh, “Why You Need a Data Intermediary,” GCN (June 16, 2016).
[xiv] See Johanna Drucker and Patrik Svensson, “The Why and How of Middleware,” Digital Humanities Quarterly 10:2 (2016) and Shannon Mattern, “Middlewhere: Landscapes of Library Logistics,” Urban Omnibus (June 24, 2015).
[xv] Aaron Brenner, personal communication, September 18, 2018.
[xvi] University of Pittsburgh, “Developing Public and Academic Libraries as Key Participants in Civic Open Data Ecosystems,” IMLS Final Project Proposal (2017): i.
[xvii] The Civic Switchboard team plans to organize monthly publicly accessible phone calls featuring successful partnerships between librarians and their local data partners in different locations. Various local examples include Case Western Reserve’s NEOCANDO, a set of tools for evaluating social policy; the Denver-based Shift Research Lab’s Community Facts; the US City Open Data Census by the Sunlight Foundation, Code for America, and Open Knowledge International; the Children’s Trust in Miami, which meets with parents, teachers, and other community members to discuss the results of local kindergarten readiness tests; and the Baltimore Neighborhood Indicators Alliance, which trains librarians to help residents use data about their neighborhoods. See “Libraries: Initial Outreach to Civic Data Partners,” Civic Switchboard (January 18, 2018). Other networks include the Libraries+ Network, a “consortium of research libraries, library organizations, and open data communities with a shared interest in saving, preserving, and making accessible born-digital federal government information” (Libraries+ Network, “About”); the Data Refuge collaboration, dedicated to preserving public climate and environmental data; and Temple University Libraries’ Future Proofing Civic Data project (Margery Sly, “Future Proofing Civic Data,” Temple University Libraries News [January 31, 2018]).
[xviii] Civic Switchboard Guide. See also Olivia Arena and Crystal Li, “The Civic Tech and Data Collaborative Guide to Civic Tech & Data Ecosystem Mapping,” Medium (June 22, 2018); Elizabeth Reynoso, Kathryn L. S. Pettit, and Christopher Whitaker, “Collaborating for 21st Century Solutions,” Medium (June 22, 2018).
[xix] Toby Greenwalt, personal communication, September 18, 2018.
[xx] Urban Greenprint; Bob Gradeck, personal communication, September 18, 2018.
[xxi] Nashin Mahtani, “Impressions of Disaster,” e-flux architecture (August 4, 2017).
[xxii] Tomas Holderness and Etienne Turpin, “From Social Media to GeoSocial Intelligence: Crowdsourcing Civic Co-Management for Flood Response in Jakarta, Indonesia,” in Social Media for Government Services (Springer 2017)[preprint]: 3.
[xxiii] Ibid., 4.
[xxiv] “About,” PetaBencana.id.
[xxv] Mahtani; Peta Jakarta, “CogniCity: Software as Infrastructure for Climate Adaptation” (video) (August 3, 2016).
[xxvi] “Data,” PetaBencana.id; “Software,” PetaBancana.id. See also Efraim Sitinjak, Bevita Meidityawati, Ronny Ichwan, Niken Onggosandojo, and Parinah Aryani, “Enhancing Urban Resilience through Technology and Social Media: Case Study of Urban Jakarta,” Procedia Engineering 212 (2018): 222–29.
[xxvii] Mahtani.
[xxviii] “PetaBencana.id Awarded a 2018 Prix Ars Electronica Honorary Mention,” Peta Bencana (July 6, 2018).
[xxix] Etienne Turpin, personal communication, September 12, 2018.
[xxx] Colin Gordon, Mapping Decline: St. Louis and the Fate of the American City (Philadelphia: University of Pennsylvania Press, 2008); ArchCity Defenders, Ascend, Metropolitan St. Louis Equal Housing and Opportunity Council (EHOC), Empower Missouri, For the Sake of All, Community Builders Network, Team TIF, et. al., Segregation in St. Louis: Dismantling the Divide (St. Louis, 2018).
[xxxi] Gordon, 13.
[xxxii] The Ferguson Commission, Forward Through Ferguson: A Path Toward Racial Equity (2015); Zoe Sullivan, “St. Louis Still Needs to Turn Racial Equity Conversations into Action,” Next City (August 24, 2018).
[xxxiii] This description of the Map Room draws from my “Mapping’s Intelligent Agents,” Places Journal (September 2017).
[xxxiv] Jer Thorp, “In the Map Room,” Medium (May 9, 2017).
[xxxv] Ibid.
[xxxvi] Jer Thorp, “Making Mapping More Human,” Medium (February 22, 2017). See also the project’s Twitter feed and listen to Thorp interviewed on St. Louis Public Radio (February 14, 2017).
[xxxvii] Jer Thorp, “In the Map Room,” Medium (May 9, 2017).
[xxxviii] Jer Thorp, personal communication, September 12, 2018.
[xxxix] Ibid.
[xl] Ronald H. Bayor, Race and the Shaping of Twentieth-Century Atlanta (Chapel Hill: University of North Carolina Press, 1996); Maurice J. Hobson, The Legend of the Black Mecca: Politics and Class in the Making of Modern Atlanta (Chapel Hill, NC: University of North Carolina Press, 2017); Larry Keating, Atlanta: Race, Class, and Urban Expansion (Philadelphia: Temple University Press, 2010); Mark Pendergrast, City on the Verge: Atlanta and the Fight for America’s Urban Future (New York: Basic Books, 2017); David Schrank, Bill Eisele, Tim Lomax, and Jim Bak, “2015 Urban Mobility Scorecard” (College Station, TX: Texas A&M Transportation Institute / INRIX, 2015); Kimberly Turner, “How Segregated Is Atlanta? This Race Map Reveals the Truth,” Curbed (June 2, 2014).
[xli] Housing Justice League and Research|Action Cooperative, Beltlining: Gentrification, Broken Promises, and Hope on Atlanta’s Southside (October 2017); Dan Immergluck and Tharunya Balan, “Sustainable for Whom? Green Urban Development, Environmental Gentrification, and the Atlanta Beltline,” Urban Geography 39:4 (2018).
[xlii] Yanni Loukissas, “Atlanta Map Room,” http://loukissas.lmc.gatech.edu (August 14, 2018).
[xliii] Yanni Loukissas, personal communication, September 14, 2018.
[xliv] Ibid.
[xlv] Anne Luther, “Local Data Design: An Interview with Professor Yanni Loukissas,” Data Matters (July 13, 2017). See also Yanni Loukissas, All Data Are Local: Thinking Critically in a Data-Driven Society (Cambridge, MA: MIT Press, forthcoming 2019).
[xlvi] Richard A. Walker, Pictures of a Gone City: Tech and the Dark Side of Prosperity in the San Francisco Bay Area (Oakland, CA: PM Press, 2018): x. See also Cary McClelland, Silicon City: San Francisco in the Long Shadow of the Valley (New York: WW Norton & Co, 2018).
[xlvii] Terra Dankowski, “A Social Worker Walks into a Library,” American Libraries (March 21, 2018); Juli Fraga, “Humanizing Homelessness at the San Francisco Public Library,” CityLab (March 29, 2016); Megan Martenyi, “Promoting Dignity, Compassion, and a Community Living Room,” Public Knowledge (June 9, 2018); David P. Moxley and June M. Abbas, “Envisioning Libraries as Collaborative Community Anchors for Social Service Provision to Vulnerable Populations,” Practice: Social Work in Action 28:5 (2016): 311–30; San Francisco Public Library, “Communities in Need – SFPL at ALA 2015” (video).
[xlviii] “Public Knowledge,” SFMOMA website. Public Knowledge was partly inspired by an earlier intervention in the library. In 2014, Chimurenga, a Cape Town–based collective, used displays, book tags, and other media to encourage patrons to find new connections, particularly those pertaining to Pan-African history and culture, within the library’s collection. See Chimurenga Library; “Collaborative Intervention: Chimurenga Library,” SFMOMA (2014); “Collaborative Intervention: Chimurenga Library,” San Francisco Public Library (2014); Installation Images, SFMOMA; Lindsey Westbrook, “Libraries and Public Knowledge: A Conversation with Michelle Jeffers and Luis Herrera,” SFMOMA.
[xlix] “Public Knowledge,” SFMOMA.
[l] “Added Value,” Public Knowledge.
[li] “Hit Parade,” Public Knowledge.
[lii] “Take Part: Collective Aesthetics,” Public Knowledge, September 15, 2018, SFMOMA.
[liii] Deena Chalabi, personal communication, August 1, 2018.
[liv] Ibid.; “Take Part,” Public Knowledge.
[lv] Deena Chalabi, personal communication, August 1, 2018; “Lit TV,” Public Knowledge.
[lvi] Noah Simblist, “Igniting the Archive,” Art in America (November 1, 2017).
[lvii] Ba?ak ?enova, “Collective Networking: Burak Arikan in Conversation with Basak Senova,” Ibraaz 7 (May 8, 2014).
[lviii] Arikan explains: “Civic data initiatives are quite different in their data work than international non-governmental organizations such as UN, OECD, World Bank, and other similar bodies. Such organizations track social, economical, political conditions of countries and concentrate upon producing general statistical data, ?whereas civic data initiatives aim to produce actionable data on issues that impact individuals directly. . . . Civic data initiatives . . . make it a priority to structure and release their data in formats that are both accessible and queryable.” Burak Arikan, “Civic Data Initiatives,” Graph Commons (June 22, 2016).
[lix] Burak Arikan, “Civic Data Solidarity,” Github (last updated February 2018).
[lx] Arikan plans to cross-reference companies’ employee information reports with data on tech unionization, investors, and “business impact.” Tomoko Kanamitsu, personal communication, September 14, 2018.
[lxi] They plan to cross-reference this qualitative data with data about public health, real estate development, and foreign capital (particularly Chinese real-estate investments).
[lxii] Burak Arikan, “Civic Data Solidarity,” Github (last updated February 2018).
[lxiii] Megan Martenyi, “9.27.17 Civic Data Solidarity Workshop Report,” Public Knowledge (September 21, 2018). See also Megan Martenyi, “Planning for Civic Data Solidarity,” Public Knowledge (September 21, 2018).
[lxiv] Martenyi, “9.27.17.”
[lxv] “Hacking Politics,” SFMOMA / Berkeley Center for New Media, October 18–19, 2018.